

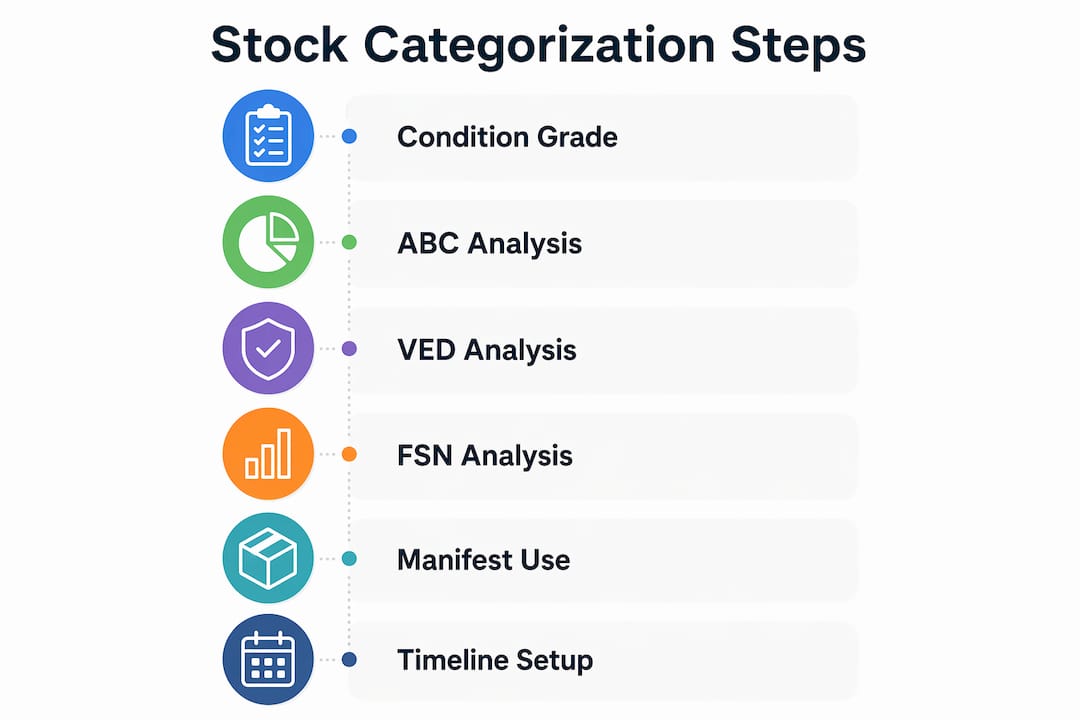
Bulk liquidation stock categorization is the process of dividing surplus inventory into condition grades and value-based segments to maximize resale recovery. Retailers and small business owners who skip this step leave money on the table. Condition grades range from New/Overstock to Salvage/As-is, and each grade commands a different price point and sales channel. The ways to categorize bulk liquidation stock covered here combine physical grading with analytical methods like ABC, VED, and FSN analysis. Together, these approaches reduce carrying costs, which consume up to 30% of inventory value annually, and help you build a repeatable system that scales.
What are the primary ways to categorize bulk liquidation stock by condition?
The five condition grades are the foundation of every liquidation inventory categorization method. Each grade tells you what the item is worth, where to sell it, and how fast you need to move it.
- New/Overstock: Factory-sealed goods that never reached a store shelf. These command the highest recovery rates and sell well on Amazon, eBay, or direct to discount retailers.
- Shelf Pulls: Items removed from retail shelves before sale. Packaging may be worn, but the product is intact. Recovery rates are strong and buyer demand is consistent.
- Open-box: Products opened but unused or lightly used. Buyers expect minor cosmetic wear. These move well through online marketplaces and outlet stores.
- Customer Returns: The most variable grade. Condition ranges from like-new to non-functional. Always inspect a sample before pricing this category.
- Salvage/As-is: Damaged, incomplete, or non-functional goods. Recovery is low, but volume sales to parts dealers or discount bins can still generate margin.
Manifested loads sell for 30–40% of MSRP, while unmanifested loads sell for only 10–20%. That gap exists because buyers pay a premium for certainty. When you know exactly what condition grade each unit carries, you price with confidence instead of guessing.
Pro Tip: Always request a manifest before purchasing a pallet of customer returns. Even a partial manifest cuts your risk significantly and helps you assign condition grades before the pallet arrives.

Which inventory valuation methods help prioritize liquidation efforts?
Physical condition grading tells you what you have. Valuation methods tell you what to sell first. The three most widely used inventory analysis techniques are ABC, VED, and FSN analysis. Using only one is the most common mistake resellers make.
ABC analysis: sort by revenue contribution
ABC analysis splits your inventory into three tiers based on revenue impact. Category A items represent 10–20% of SKUs but generate 70–80% of revenue. These are your priority items. Handle them carefully, price them accurately, and list them on your highest-traffic channels first. Category B items are mid-range contributors. Category C items may make up 50% of your stock but yield only about 5% of revenue. Move Category C fast through bulk lots or discount bins rather than spending time on individual listings.
VED analysis: sort by operational criticality
VED stands for Vital, Essential, and Desirable. This method is most useful when you are managing large bulk liquidation inventory that includes parts, tools, or components. Vital items are those buyers cannot substitute. Essential items are important but have alternatives. Desirable items are nice-to-have. Knowing which category an item falls into helps you decide whether to hold it for a specialized buyer or bundle it into a general lot.
FSN analysis: identify dead stock before it costs you
FSN analysis categorizes inventory as Fast-moving, Slow-moving, or Non-moving. Carrying inventory consumes up to 30% of product value annually, so non-moving stock is a direct drain on your cash flow. Set a clear threshold, such as no sales in 24 months, to flag items as obsolete. Once flagged, move them immediately through bulk lots or salvage channels rather than holding out for full retail recovery.
The real power comes from combining all three methods. Run ABC to find your high-value SKUs, FSN to flag dead stock, and VED to identify specialty items worth holding for the right buyer. This three-layer approach is how experienced resellers scale liquidation operations efficiently without losing margin on slow movers.
How do liquidation manifests improve categorization accuracy?
A liquidation manifest is a document that lists every item in a pallet or truckload, including product name, SKU, quantity, retail price, and condition code. Reading one correctly is a skill that directly improves your categorization decisions.
- Check the condition codes first. Most manifests use standard codes: “New,” “Like New,” “Good,” “Acceptable,” and “Salvage.” Map these to your own grading system before you sort a single item.
- Calculate the total MSRP. Add up the retail values listed on the manifest. Then apply the expected recovery rate for the dominant condition grade. This gives you a realistic revenue ceiling before you spend a dollar.
- Identify SKU mix and category spread. A manifest heavy in electronics requires different handling than one full of apparel. Electronics need functional testing; apparel needs size and brand sorting. Knowing the mix upfront lets you allocate labor correctly.
- Flag high-value individual units. A single high-ticket item, such as a smart TV or power tool, can represent a large share of a pallet’s total value. Identify it on the manifest and pull it for individual listing rather than bundling it into a lot.
- Compare manifested versus actual counts on arrival. Discrepancies between the manifest and physical inventory signal either shipping loss or manifest inaccuracy. Document these gaps to negotiate with your supplier and refine future purchasing decisions.
Using manifests reduces risk compared to blind, unmanifested purchases. Palletliquidationsokc provides detailed guidance on reading liquidation manifests to help resellers make faster, more accurate categorization calls.
Pro Tip: Build a simple spreadsheet template that pulls manifest data into condition-grade buckets automatically. After three or four loads, you will have a reliable baseline for recovery rates by category and supplier.
What is the recommended timeline for implementing stock categorization?
A structured timeline prevents the two most costly mistakes in liquidation: rushing to sell before categorization is complete, and holding stock so long that carrying costs eat your margin. A 4 to 12-week plan is the industry-recommended framework for liquidation projects.
- Weeks 1–2: Assess and categorize. Sort all incoming inventory by condition grade. Run ABC and FSN analysis on your existing stock. Identify current, excess, and obsolete segments. Select your sales channels based on condition and value data.
- Weeks 3–4: List high-priority items. Category A and New/Overstock items go live on your primary channels first. These generate the fastest cash return and fund the rest of the operation.
- Weeks 5–8: Work through mid-tier stock. Shelf pulls, open-box, and Category B items move through secondary channels such as outlet stores, discount retailers, or online marketplaces. Adjust pricing weekly based on sell-through rates.
- Weeks 9–12: Clear slow movers and salvage. Bundle Category C and non-moving items into bulk lots. Move salvage through specialty buyers or parts dealers. Accept lower recovery rates here rather than extending carrying costs further.
Structured liquidation over a 4 to 12-week period yields better margins than forced fire sales. The reason is simple: fire sales compress all your inventory into one price point, destroying the premium you could have earned on your best-condition items. Segmenting by condition and value lets you extract maximum recovery from each tier before moving to the next.
Inventory classification into current, excess, and obsolete stock is the single most effective way to build this timeline. Without that segmentation, every item competes for the same attention and the same sales channel, which is exactly how margins collapse.
Understanding liquidation inventory valuation methods also helps you set realistic price floors at each stage, so you never sell a Category A item at a Category C price.
Key Takeaways
Combining physical condition grading with ABC, VED, and FSN analysis is the most effective system for categorizing bulk liquidation stock and protecting resale margins.
| Point | Details |
|---|---|
| Use five condition grades | Grade every item as New, Shelf Pull, Open-box, Return, or Salvage before pricing or listing. |
| Apply ABC analysis first | Category A items are 10–20% of SKUs but drive 70–80% of revenue; list them on top channels first. |
| Flag dead stock with FSN | Items with no sales in 24+ months drain up to 30% of their value annually in carrying costs. |
| Read manifests before buying | Manifested loads recover 30–40% of MSRP versus 10–20% for unmanifested loads. |
| Follow a 4 to 12-week plan | Structured timelines outperform fire sales by preserving premium recovery on high-grade items. |
What I have learned from years of watching resellers get categorization wrong
Most resellers I have seen lose money on liquidation do not lose it because they bought bad stock. They lose it because they treated a mixed pallet as a single asset. A pallet of customer returns might contain a brand-new open-box tablet, a functional but scratched coffee maker, and a completely broken blender. Selling all three at the same price, or worse, bundling them into one lot, destroys the margin on the tablet.
The other mistake I see constantly is skipping the analytical layer entirely. Condition grading alone is not enough. You need FSN analysis to catch the slow movers before they become dead weight, and ABC analysis to make sure you are spending your listing time on the items that actually move the needle. Combining physical grading with valuation methods is what separates resellers who build sustainable businesses from those who are always scrambling.
The uncomfortable truth about unmanifested loads is that they are not a bargain. They are a gamble. The 10–20% MSRP recovery rate on blind loads reflects the risk premium buyers demand for uncertainty. If you are buying unmanifested stock regularly, you are funding someone else’s risk management strategy, not your own.
My strongest advice: slow down in weeks 1 and 2. The categorization work you do at the front end of a liquidation cycle determines every pricing and channel decision that follows. Rushing that phase to get items listed faster almost always costs more than the time it saves.
— elianne
How Palletliquidationsokc supports your categorization and resale process
Palletliquidationsokc connects retailers and small business owners with manifested wholesale pallets across electronics, apparel, tools, and household goods sourced from major national retailers.
Every pallet listing includes condition information to help you apply the grading and valuation methods covered here before you buy. Whether you are building your first categorization system or looking to refine an existing one, the wholesale pallets for Amazon sellers and discount retailers on the platform are graded and ready to sort. The buyer’s guide for wholesale liquidation pallets walks you through supplier selection, manifest interpretation, and channel matching so your categorization work translates directly into higher recovery rates.
FAQ
What are the five condition grades in liquidation stock?
The five standard grades are New/Overstock, Shelf Pulls, Open-box, Customer Returns, and Salvage/As-is. Each grade carries a different recovery rate, ranging from 10% to 60% of original MSRP.
What is ABC analysis in liquidation inventory?
ABC analysis ranks inventory by revenue contribution. Category A items are 10–20% of SKUs but generate 70–80% of revenue, making them the first priority for careful listing and pricing.
Why does a liquidation manifest matter for categorization?
A manifest lists each item’s SKU, condition, quantity, and retail value. Manifested loads recover 30–40% of MSRP compared to 10–20% for unmanifested loads, making them significantly lower risk.
How long should a liquidation categorization process take?
Industry practice recommends dedicating weeks 1 and 2 of a 4 to 12-week liquidation plan to inventory assessment, condition grading, and sales channel selection before any items go live.
What is FSN analysis and when should I use it?
FSN analysis identifies Fast-moving, Slow-moving, and Non-moving inventory. Use it to flag items with no sales in 24 or more months so you can liquidate them before carrying costs consume their remaining value.
Recommended
- Resale Profit Liquidation Inventory Tips -Pallet Liquidation
- Best Liquidation Inventory for Discount Stores – Pallets USA
- How to Price Liquidation Resale Inventory – Pallets in USA
- Liquidation Inventory – Pallet Liquidation Wholesale in USA
